Data Tables
Design System
Good data tables are important for most enterprise projects and products involving analytics and data collection. When designed well, tables enable users to easily navigate the data and find the exact information they need. However, designing data tables can be complicated and challenging.
In Meijer warehouse management system, there were over 100s of tables, all of them with different users, and multiple use cases. Individually designing and developing for all would be inconsistent and inefficient. I had to design a table design that can be customized by the designers, product owners and users.
Approach
Step 1
Gathering all the different types of data and patterns in the table.
Step 2
Creating a table system that enables a versatile range of possibilities.
Step 3
Documenting well devised table patterns and guidelines to control how it is used.
Step 4
Designing tailored tables based on the system and guidelines.
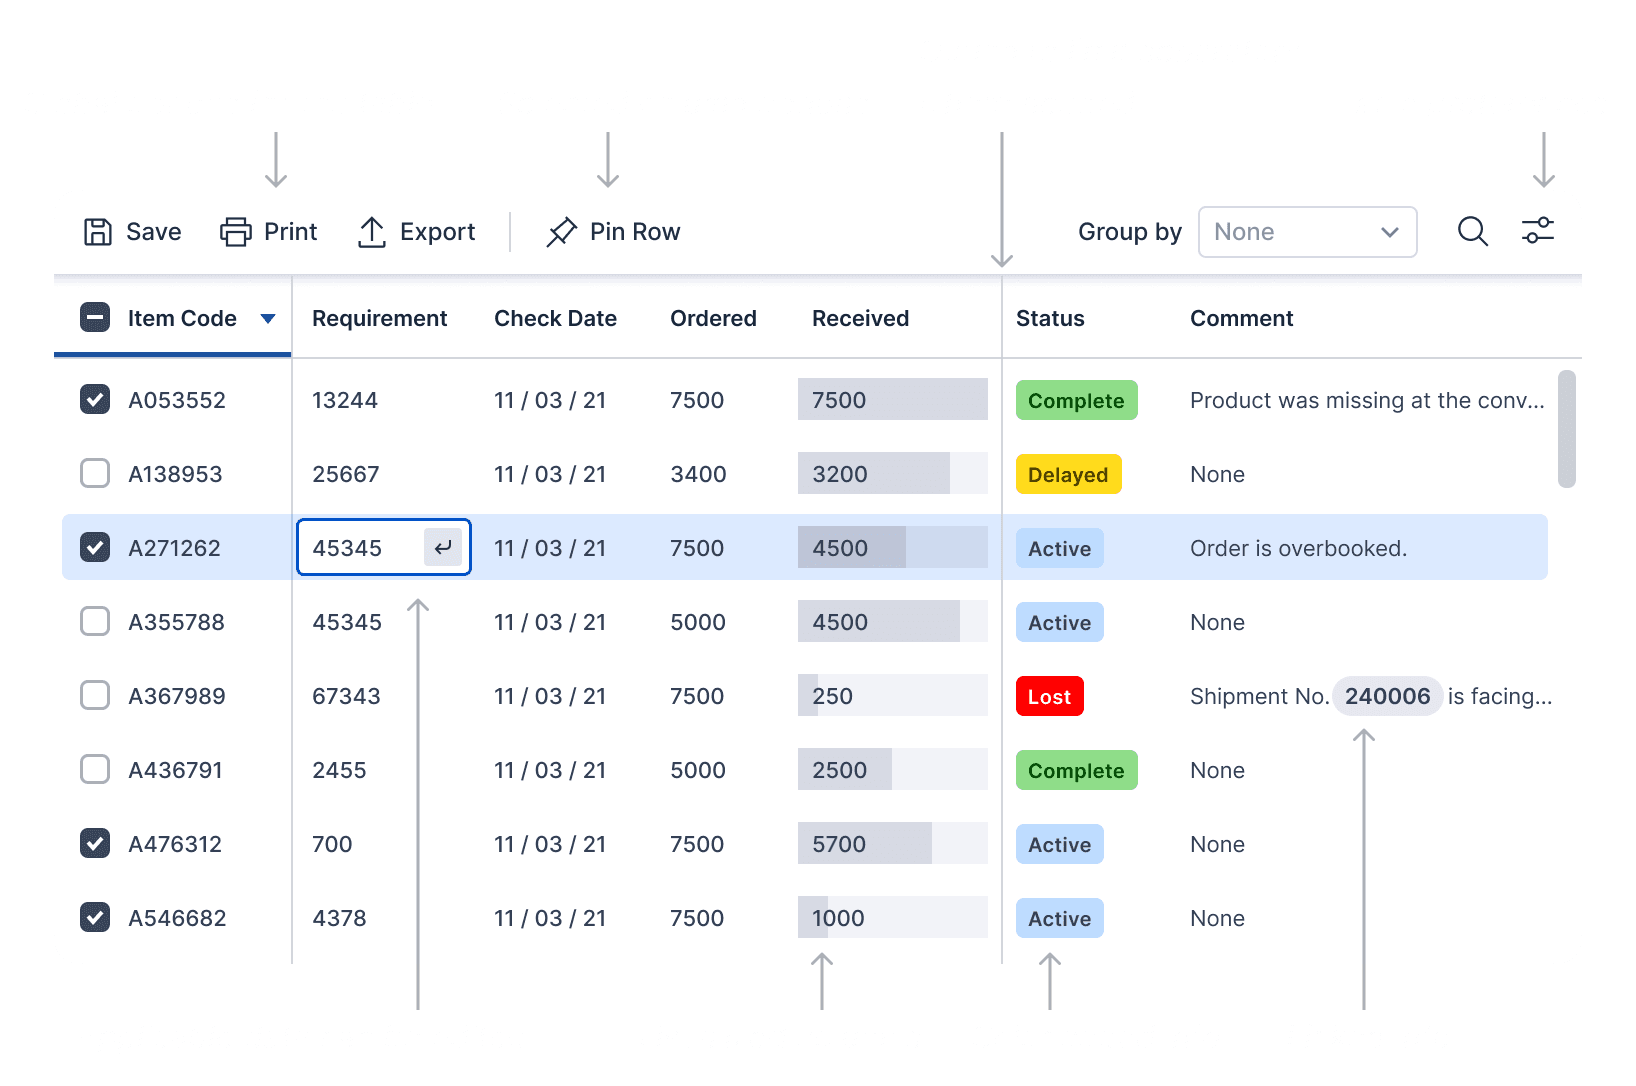
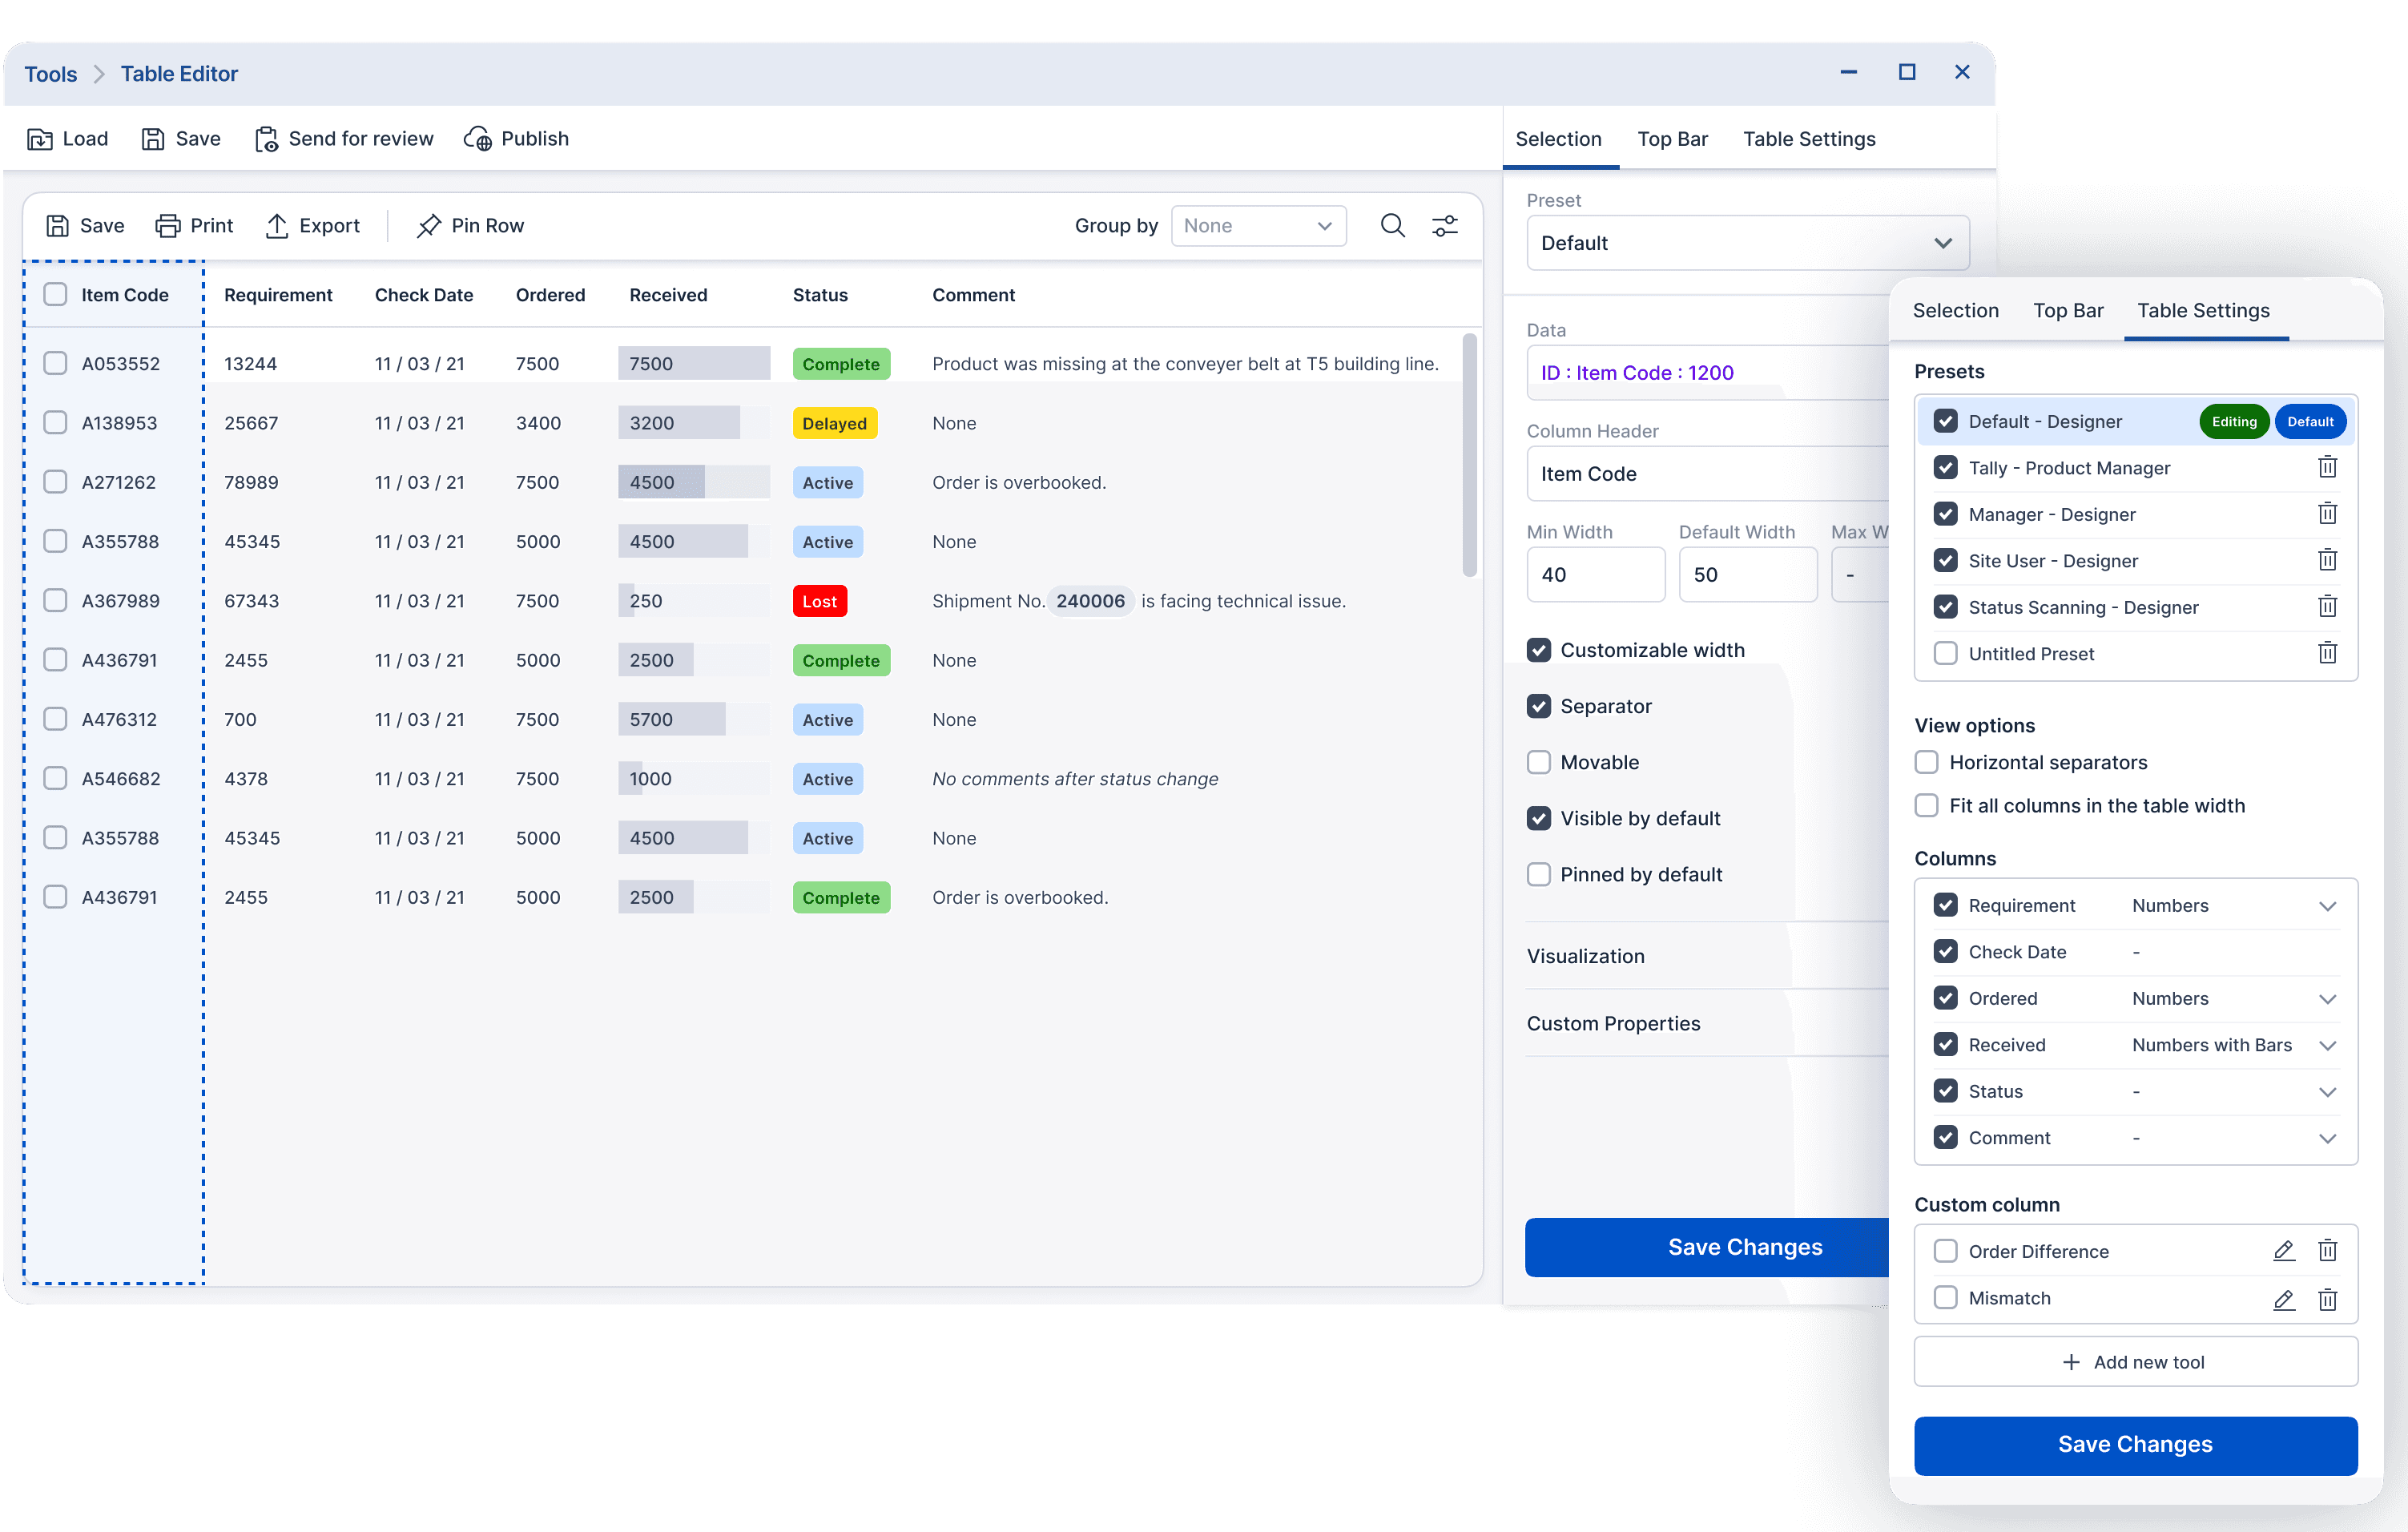
A typical table
A typical table made with the table system showcasing some many of the features.
Features
Here are some of the features we incorporated in the table design.
Editing data
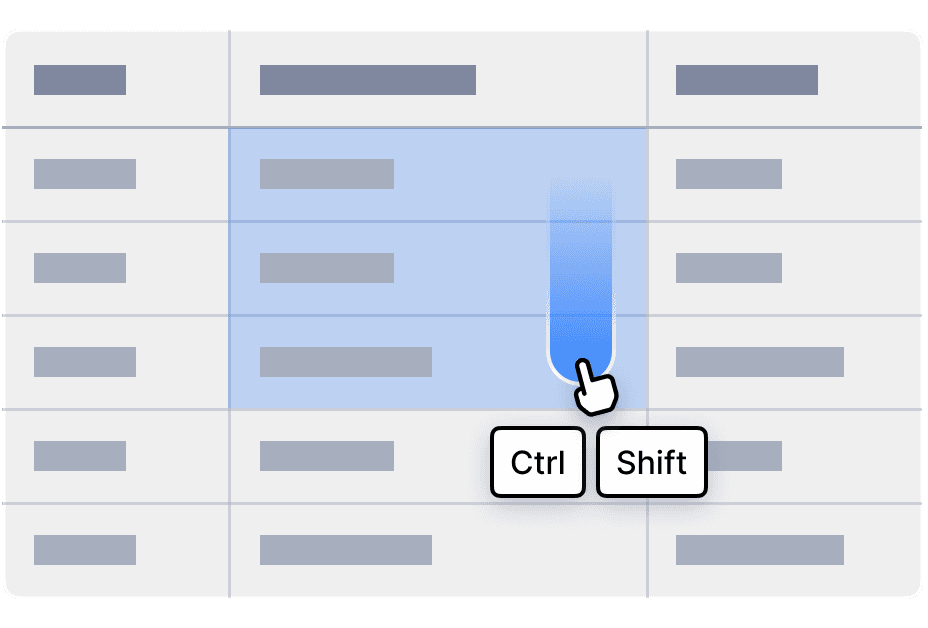
Batch editing
Two ways to batch edit, click on cells while pressing Ctrl + Shift. Or, clicking and dragging to select a continuous set of cells to edit.
Grouping
In many scenarios, ability to group rows helps to better work with large amounts of data and prevent missing out on a piece of data.
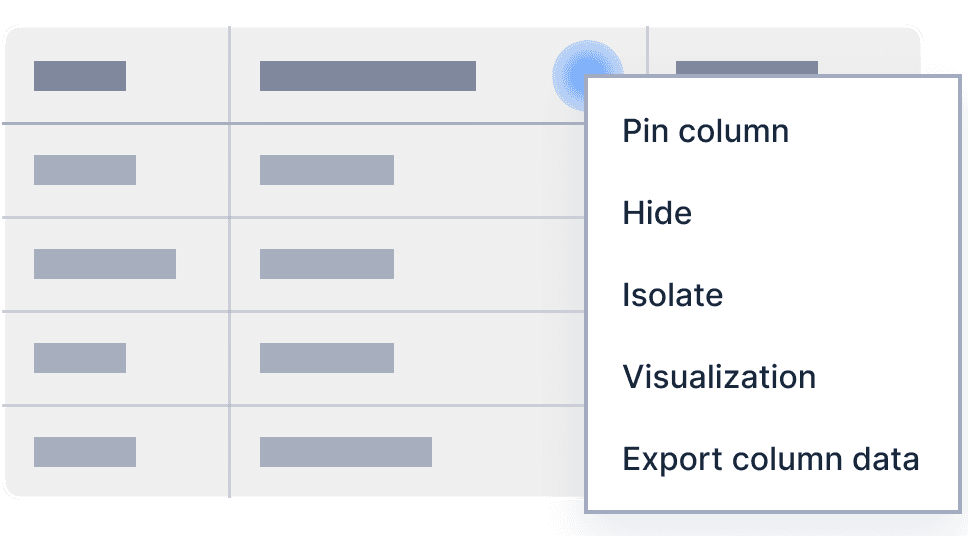
Fixed columns
When a table contains numerous columns, scrolling horizontally can make it difficult to remember which data point belongs to which. User has the option to fix any column in the table view.
Other column options
Option to hide a column
Isolate a column
Export just a column’s entire data
Search & Filter
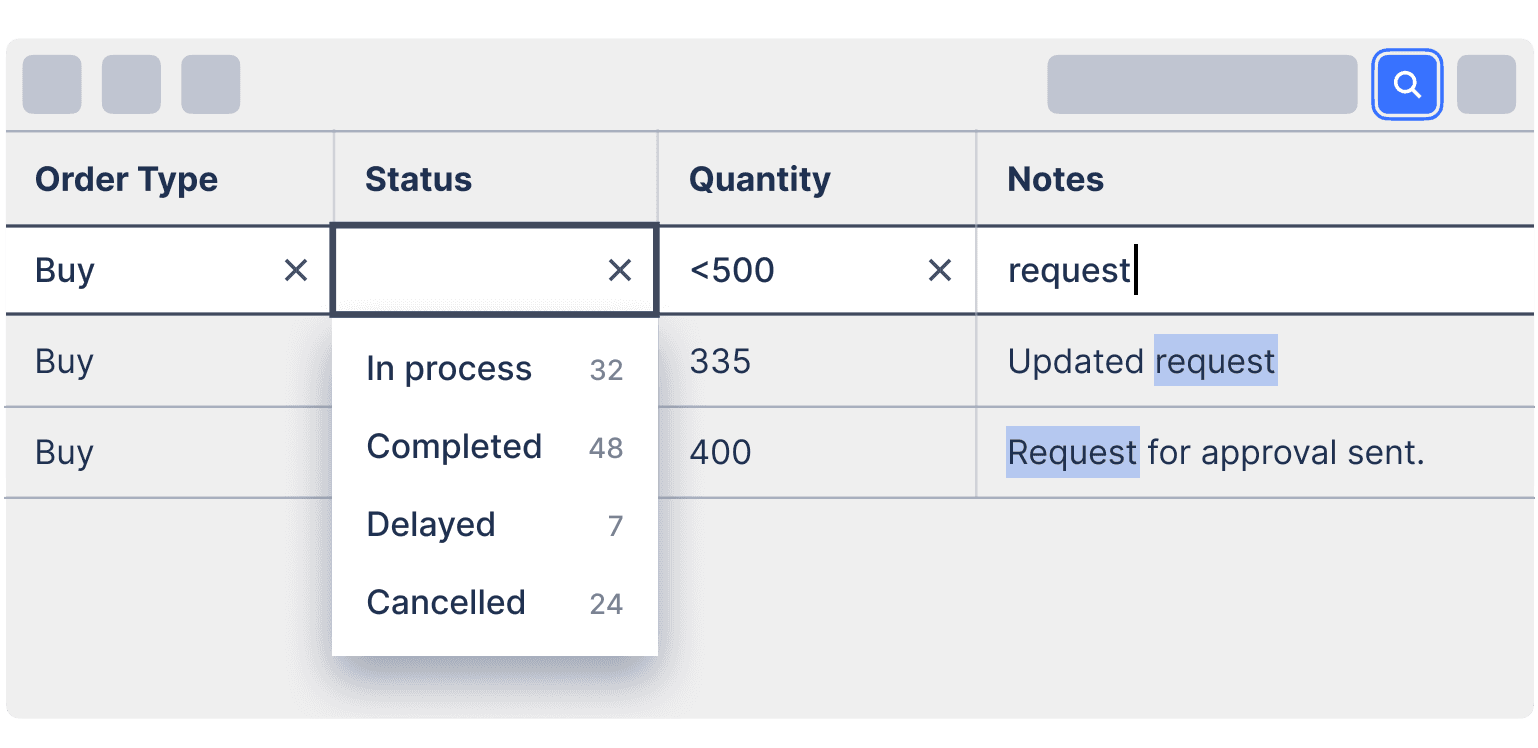
In a scenario where a user needs to locate a specific entry in the remarks—specifically, a buy order in progress with a quantity of less than 500—two conventional methods exist.
The first involves scanning through the entire list, which is time-consuming. The second method entails sorting one column at a time, but this becomes impractical when searching for multiple data points across various categories in a table.
The solution involves implementing a search toggle option. When activated, users can input or select values in one or multiple fields, and they can also incorporate logical operators such as <, >, or = to refine their search criteria. In case where there are recurring entries in a column, example, buy or sell multiple times, as the user clicks on the applicable column search field, the list of those entries along with each's count is also shown.
Table preferences
Tables are versatile tools utilized for various purposes and optimizing them for a specific use case can significantly affect other use cases. By customization, tables can be tailored to specific needs and easily switched between different setups.
Custom column
In a standard table setup, it's not uncommon to have as many as 20 columns, with additional derived information presented in various forms. Custom columns enable the addition of new data points derived from existing information within the table, allowing for dynamic visualization as required.
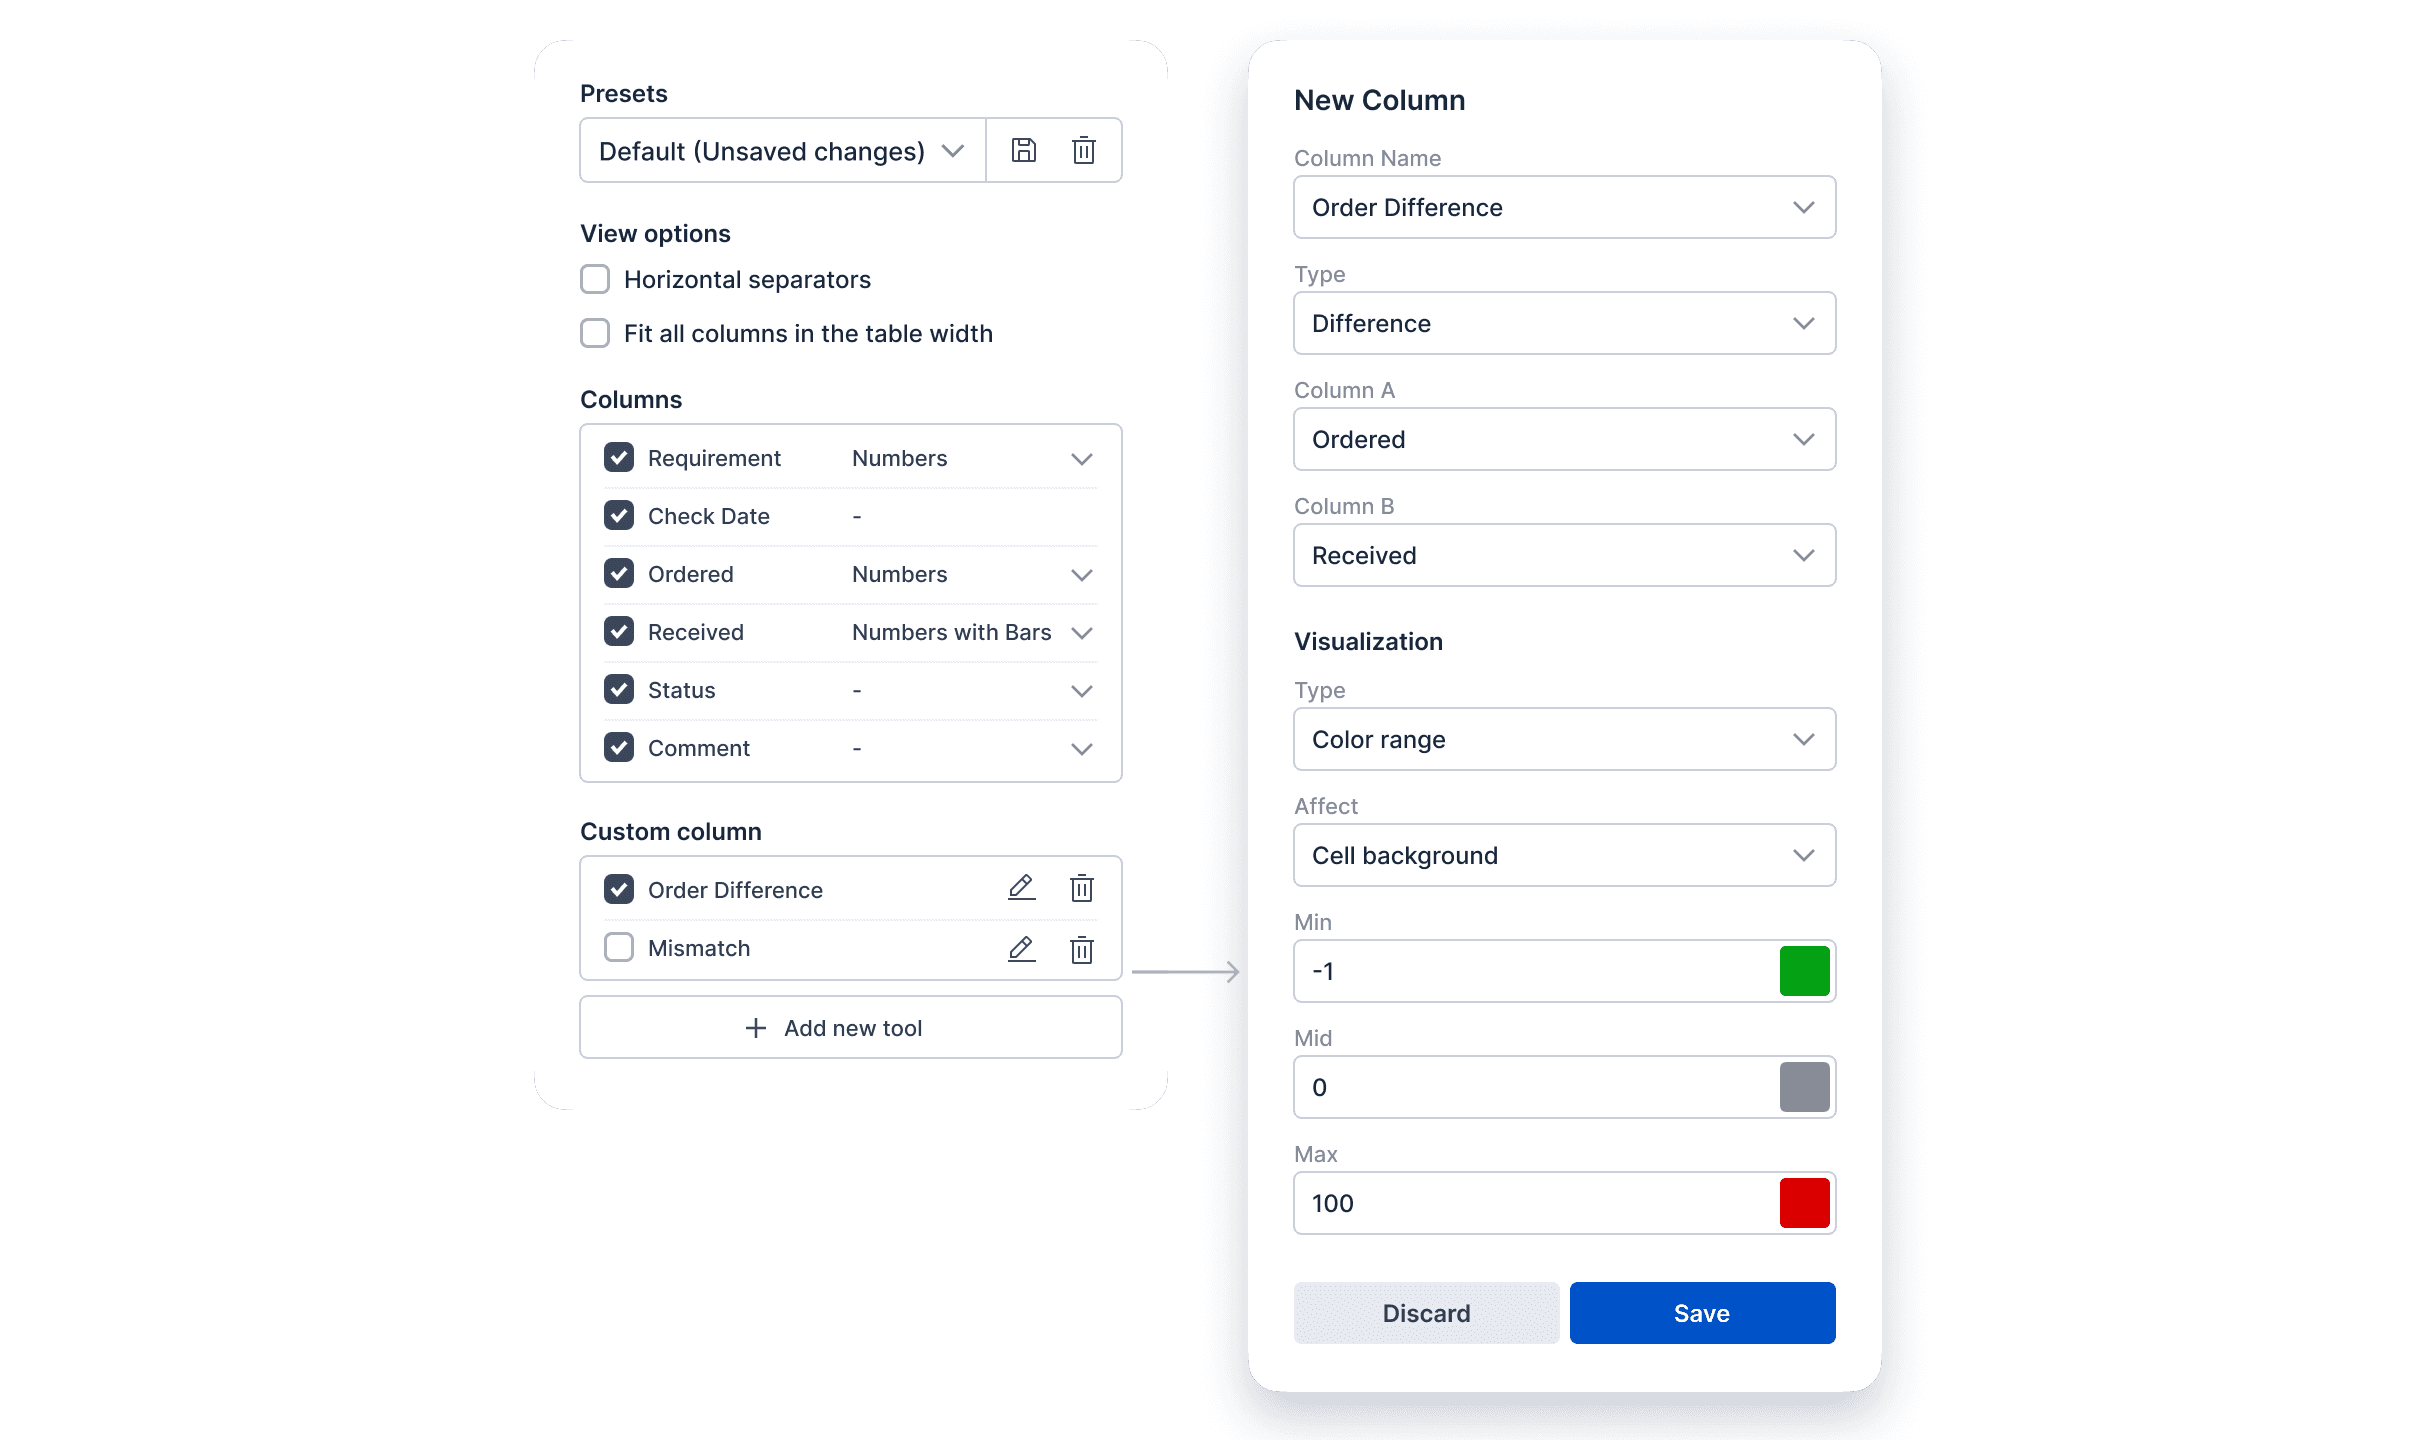
Table Editor
Once the system and guidelines are in place, designing 100+ tables with multiple configurations is a time taking task for designers as well as developers, which is why we also proposed a table editor, where a designers, and product owners can create tables and customize every aspect of the table that the system allows.
Keyboard interactions
Follows Adobe spectrum guidelines.
Design guidelines
With so many possibilities, bigger room for bad design is introduced. To avoid that I wrote a set of design guidelines to ensure consistency and good usability. Ranging from how much breathing room should be decided to the readability of information on case to case basis.

